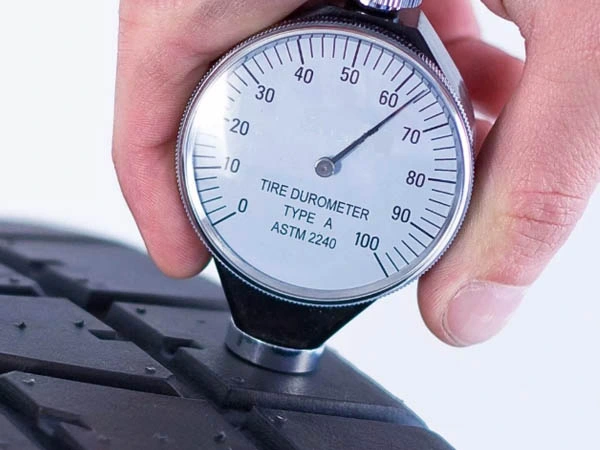
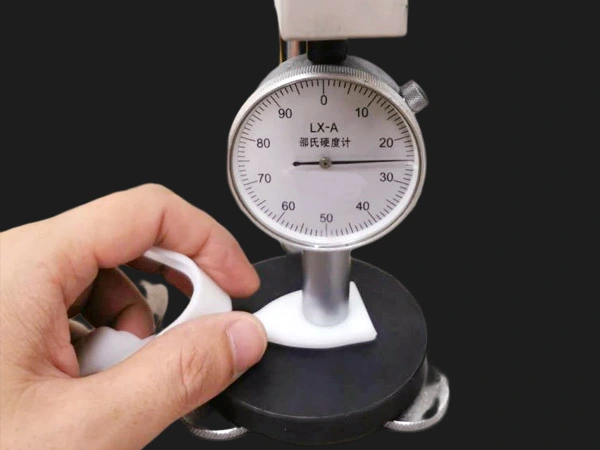
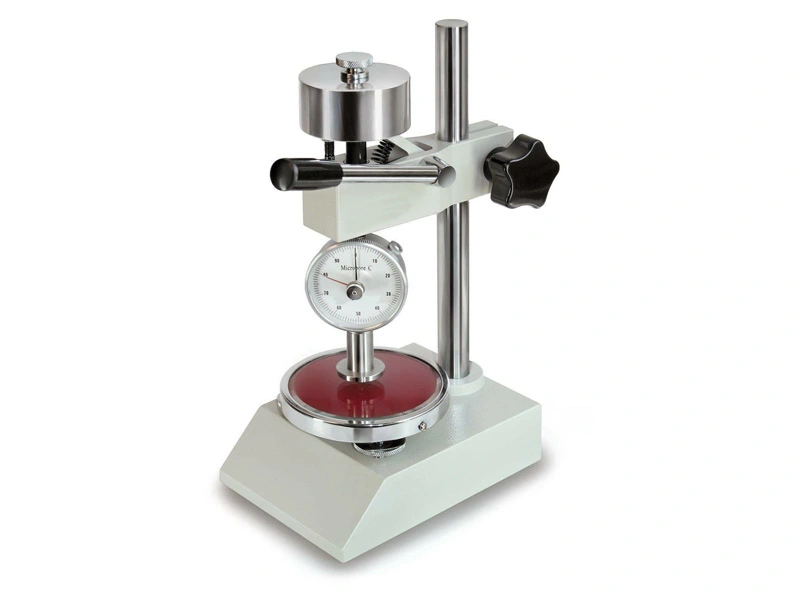
In the design and specification of rubber, elastomer, and polymer materials, Hardness (Durometer) is one of the most straightforward, yet frequently misunderstood, performance metrics. It relates not only to the material's feel and flexibility but is directly tied to critical engineering properties such as sealing capabilities, resilience, abrasion service life, and compression set.
This article, from an engineer's perspective, systematically analyzes the four most common Shore scales—A, D, C, and OO—delving into their respective testing principles, application scenarios, the relationships between the scales, and how to correctly interpret and apply hardness data.
 Shore Hardness Durometer
What is Shore Hardness?
Shore Hardness is a standardized test method used to quantify a material's—primarily elastomers (like rubber) and polymers (like plastic)—resistance to permanent indentation.
The core testing principle uses an instrument called a "Durometer" to apply a specific force, via an internal spring, driving a standardized indenter vertically into the material's surface.
The final reading displayed by the durometer is a dimensionless value between 0 and 100, which is inversely proportional to the depth of the indenter's penetration:
- A reading of 100: Represents zero penetration (0 mm indentation depth), indicating the material has reached the maximum hardness measurable by that scale.
- A reading of 0: Represents the indenter penetrating its maximum designed travel (typically 2.5 mm), indicating the material is extremely soft and below the effective measurement floor of the scale.
Core Standard: ASTM D2240
Nearly all Shore hardness testing adheres to ASTM D2240 (“Standard Test Method for Rubber Property—Durometer Hardness”), the authoritative specification. This standard details the precise instrument specifications, indenter shape, spring force, sample preparation, and testing procedures for all 12 durometer types (including Shore A Durometer, Shore D Durometer, Shore C Durometer, and Shore OO Durometer, among others).
ASTM D2240 specifies the critical prerequisites for obtaining repeatable readings:
- Sample Thickness: The standard test specimen thickness must be at least 6.4 mm (approximately 1/4 inch).
- Sample Surface: The sample must be placed on a firm, flat surface, and the pressure foot of the durometer must make complete contact with the sample surface.
If the sample is too thin, the force applied by the indenter will "punch through" the sample, essentially measuring the combined hardness of the sample and the hard test bench below. This will result in an erroneously high reading.
Physical Differences and Applications
The reason multiple Shore scales exist is that a single indenter and spring force cannot cover the entire range of materials, from gels to rigid plastics. Each scale is physically a distinct testing system, differing primarily in:
- The geometric shape of the Indenter
- The magnitude of the Spring Force
Selecting the wrong scale for a specific material will yield a meaningless reading. For instance, using the sharp D-type indenter on a soft gel will simply pierce it.
1. Shore A
Application Range: This is the most frequently used scale in the rubber and elastomer industry. It covers materials from very soft to medium-hard, with a typical engineering range of 20A to 90A. Applications include flexible RTV-2 silicone, O-rings, automotive tire treads, shoe soles, and Thermoplastic Elastomers (TPE).
- Indenter Shape: 35-degree Truncated Cone (a flat-tipped cone).
- Spring Force: 8.05 Newtons (N) (approx. 822 gram-force).
 Shore A Durometer
2. Shore D
Application Range: When material hardness exceeds the upper limit of the A scale (i.e., above 90A), the Shore D Durometer should be used. It is primarily used to measure hard rubber, semi-rigid plastics, and rigid plastics. Common examples include construction hard hats, PVC piping, golf balls, and polyurethane rollers.
- Indenter Shape: 30-degree Cone (tip radius 0.1 mm), much sharper than the Type A indenter.
- Spring Force: Maximum 44.45 Newtons (N) (approx. 4.5 kilogram-force), significantly greater than Type A.
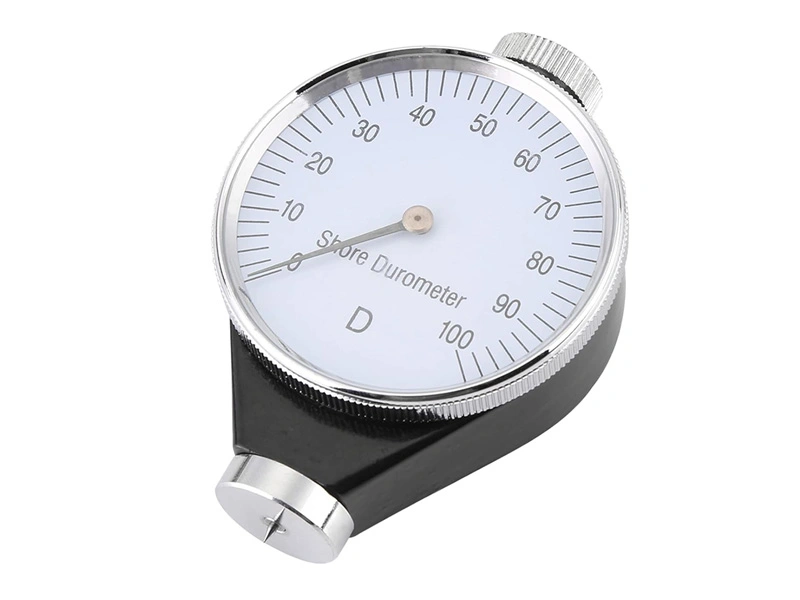 Shore D Durometer
3. Shore C
Application Range: Used to measure medium-hard elastomers and plastics. Shore C measurement overlaps the high end of the A scale and the low end of the D scale. Shore C provides a more precise measurement when a material is too hard for the A scale (> 90A) but too soft for the D scale (< 20D).
- Indenter Shape: Same as Shore A (35-degree Truncated Cone).
- Spring Force: Same as Shore D (44.45 Newtons (N)).
(Note: Shore C combines the A indenter and the D spring force and is used in some specific standards for fine-tuning formulations).
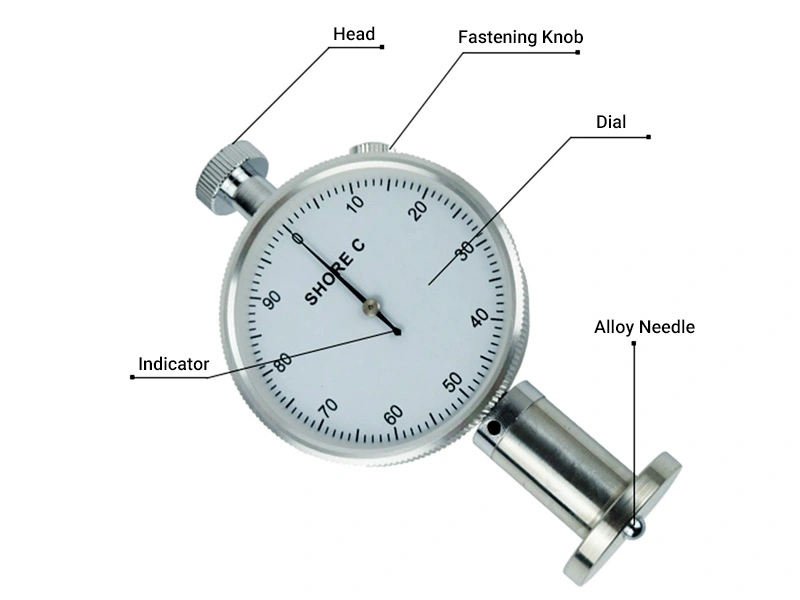 Shore C Durometer
4. Shore OO
Application Range: Used to measure extremely soft materials. If a material's Shore A reading is below 10A, the Shore OO Durometer should be used. Typical applications include gels, silicone grease, sponges, foams, and artificial skin materials.
- Indenter Shape: 1.20 mm radius spherical ball indenter.
- Spring Force: Extremely small, maximum only 1.111 Newtons (N) (approx. 113.3 gram-force).
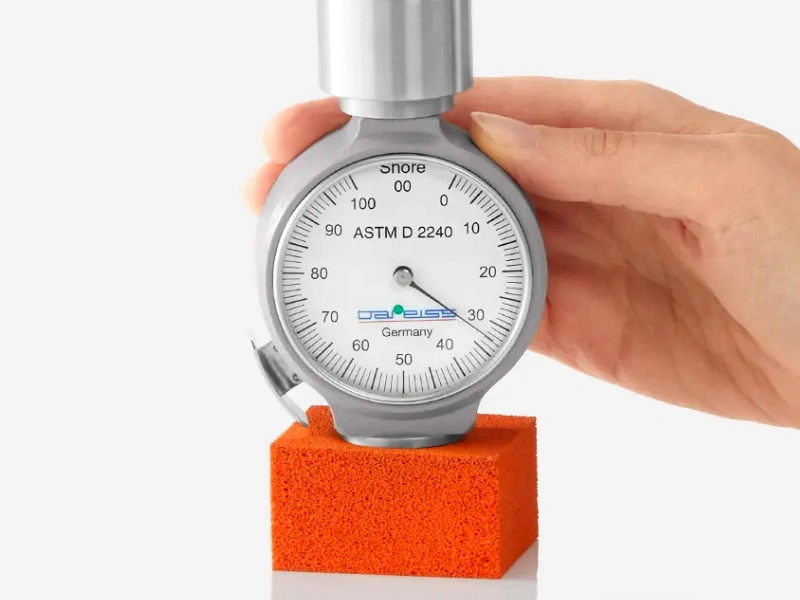 Shore OO Durometer
Engineer's Rule of Thumb:
- If the Shore A measurement is above 90A, switch to the Shore D scale.
- If the Shore D measurement is below 20D, switch to the Shore A scale.
Shore Hardness Conversion
In materials engineering, a frequent need is to compare hardness values across different scales, such as converting Shore A to Shore D. However, it must be explicitly stated: this is scientifically imprecise.
As noted above, the A, D, C, and OO scales use completely different indenter geometries and wildly differing spring forces. They measure the material's physical response under distinct conditions (e.g., Shore A measures "compression resistance," while Shore D measures "penetration resistance").
Therefore, any "conversion chart" or "conversion graph" is an approximation derived from comparing large amounts of empirical data, not an exact calculation. These tables should only be used in the initial design phase or for communicating the approximate material category to clients.
| Shore A (Reference Range) | Approximate Shore C | Approximate Shore D | Approximate Shore OO |
|---|---|---|---|
| 10–30 A | 20–35 C | - | 40–70 OO |
| 40–60 A | 35–55 C | 10–20 D | 70–90 OO |
| 70–85 A | 50–70 C | 18–28 D | - |
| 90–100 A | 65–85 C | 30–55 D | - |
Important Note: This table is empirical and lacks engineering precision. For setting technical specifications or performing quality control, actual measurements must be taken using the target scale (A, D, C, or OO).
Conclusion
Shore hardness is only one factor in material performance. The final material specification process must also include a comprehensive evaluation of other mechanical properties and the operating environment. Factors such as tensile strength, elongation at break, compression set, chemical compatibility, working temperature range, and end-user tactile requirements all directly impact the material's suitability.
Therefore, to select the most appropriate elastomer for complex applications, you must balance the hardness against these other performance indicators to ensure the material has a fully matched performance profile.